Financial Highlight
Fact Book
■ Fact Book(FYE3/2016-FYE3/2025)
Performance Trends (Consolidated)
(Unit: million yen)| FYE 3/2021 | FYE 3/2022 | FYE 3/2023 | FYE 3/2024 | FYE 3/2025 | |
|---|---|---|---|---|---|
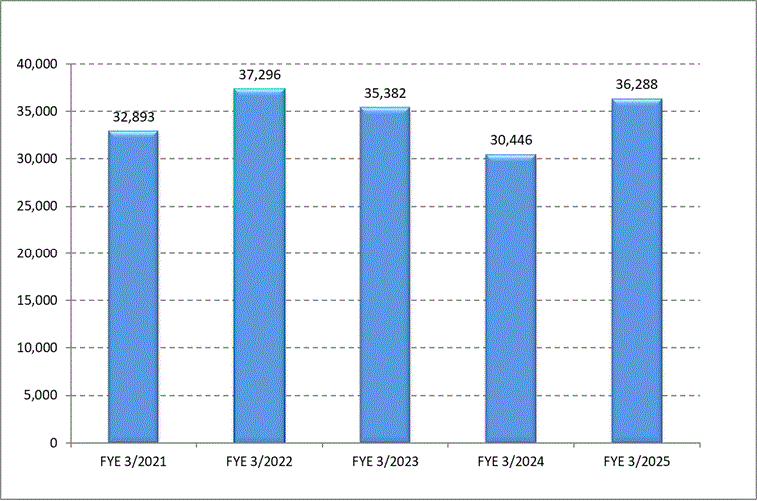
| Sales Revenue | 32,893 | 37,296 | 35,382 | 30,446 | 36,288 |
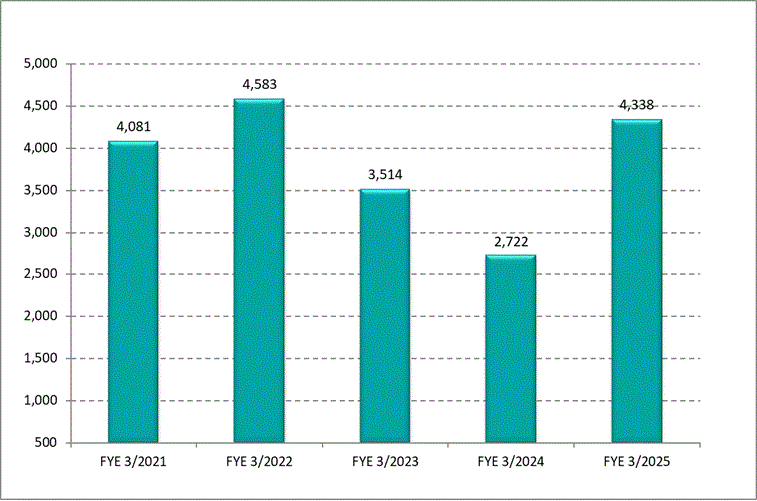
| Operating Profit | 4,081 | 4,583 | 3,514 | 2,722 | 4,338 |
| Ordinary Profit | 4,020 | 5,707 | 4,347 | 3,064 | 4,161 |
| Profit Attributable to Owners of Parent | 2,959 | 5,364 | 2,280 | 1,845 | 2,892 |
| Net Assets | 36,758 | 42,728 | 43,162 | 44,501 | 44,992 |
| Total Assets | 52,933 | 56,598 | 55,471 | 58,618 | 60,725 |
| Equity Capital | 36,220 | 42,170 | 42,875 | 44,261 | 44,752 |
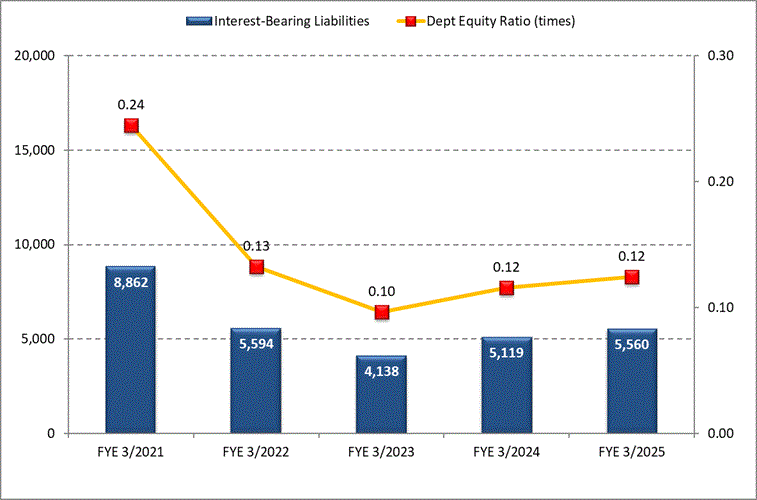
| Interest-Bearing Liabilities | 8,862 | 5,594 | 4,138 | 5,119 | 5,560 |
| Dept Equity Ratio (times) | 0.24 | 0.13 | 0.10 | 0.12 | 0.12 |
| Capital Expenditures | 1,818 | 2,648 | 5,408 | 5,708 | 3,924 |
| Depreciation & Amortization | 3,039 | 2,713 | 2,593 | 2,768 | 2,812 |
| Research & Development Expenses | 793 | 744 | 660 | 698 | 597 |
| FYE 3/2021 |
FYE 3/2022 |
FYE 3/2023 | FYE 3/2024 | FYE 3/2025 | |
|---|---|---|---|---|---|
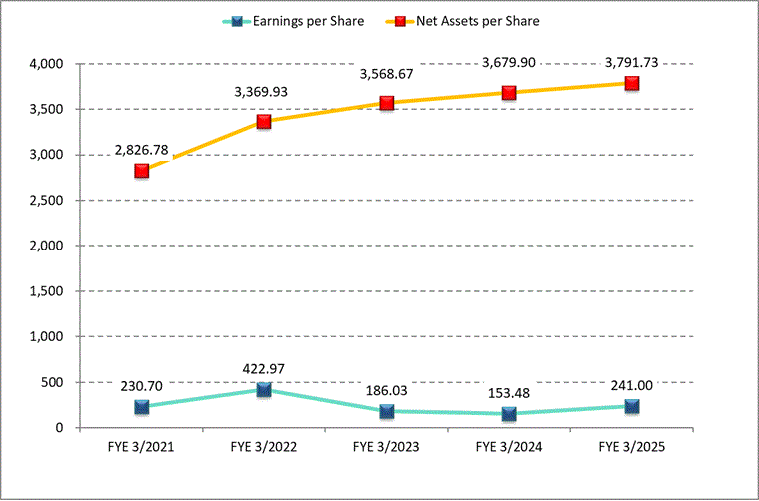
| Earnings per Share | 230.70 | 422.97 | 186.03 | 153.48 | 241.00 |
| Net Assets per Share | 2,826.78 | 3,369.93 | 3,568.67 | 3,679.90 |
3,791.73 |
| Dividends per Share | 47.00 | 60.00 | 60.00 | 154.00 |
170.00 |
| Interim Dividends | 22.00 | 24.00 | 30.00 | 60.00 | 85.00 |
| Year-End Dividends | 25.00 | 36.00 | 30.00 | 94.00 | 85.00 |
(Unit: %)
| FYE 3/2021 |
FYE 3/2022 |
FYE 3/2023 | FYE 3/2024 |
FYE 3/2025 |
|
|---|---|---|---|---|---|
| Net Profit Ratio | 9.0 | 14.4 | 6.4 | 6.1 | 8.0 |
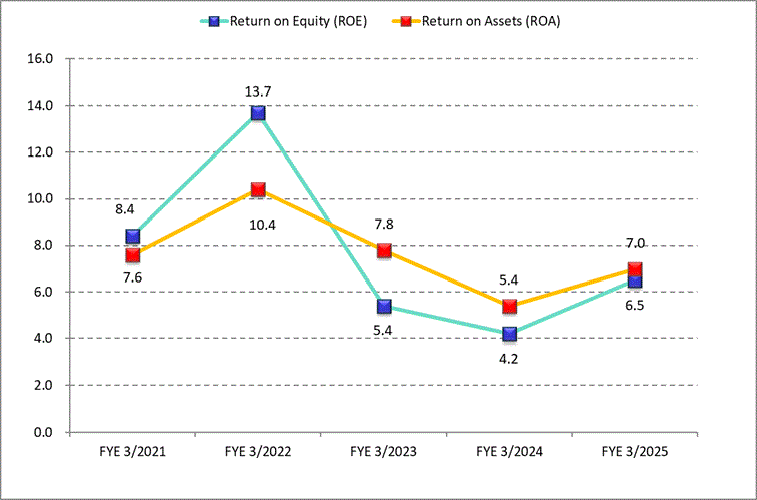
| Return on Equity (ROE) | 8.4 | 13.7 | 5.4 | 4.2 | 6.5 |
| Return on Assets (ROA) |
7.6 |
10.4 | 7.8 | 5.4 | 5.4 |
Sales Revenue
Operating Profit
Earnings per Share / Net Assets Per Share
Return on Equity(ROE) / Return on Assets(ROA)
Interest-Bearing Liabilities / Dept Equity Ratio (times)
Sales Revenue by Segment
(Unit: million yen)| FYE 3/2021 | FYE 3/2022 | FYE 3/2023 | FYE 3/2024 | FYE 3/2025 | |
|---|---|---|---|---|---|
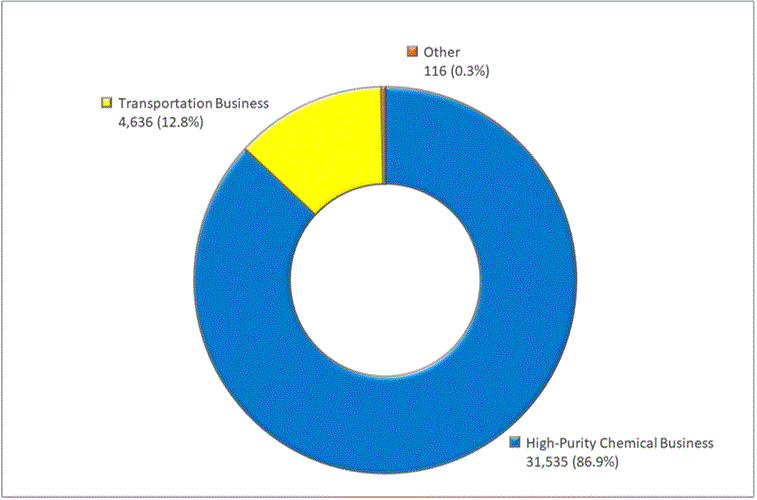
| High-Purity Chemical Business | 28,404 | 32,330 | 30,707 | 26,019 | 31,535 |
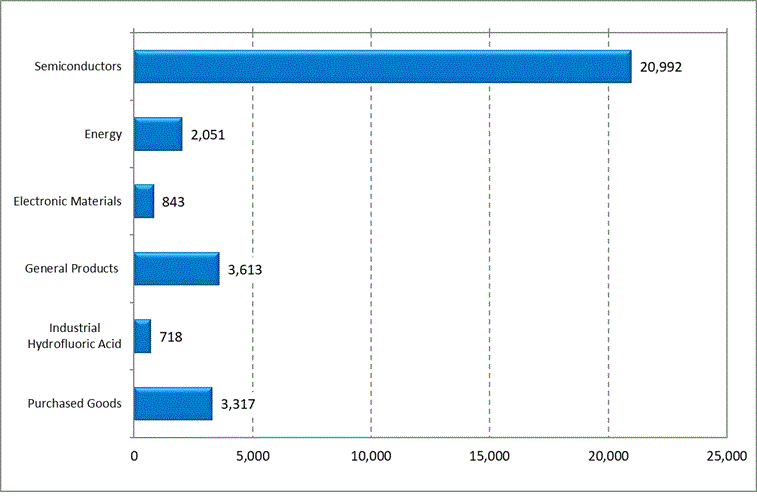
| - Semiconductors | 16,283 | 17,859 | 19,049 | 18,341 | 20,992 |
| - Energy | 2,860 | 3,121 | 996 | 1,152 | 2,051 |
| - Electronic Materials | 813 | 1,280 | 1,032 | 592 | 843 |
| - General Products | 2,305 | 2,246 | 2,514 | 2,060 | 3,613 |
| - Industrial Hydrofluoric Acid | 3,175 | 3,919 | 1,739 | 696 | 718 |
| - Purchased Goods | 2,966 | 3,904 | 5,375 | 3,177 | 3,317 |
| Transportation Business | 4,069 | 4,676 | 4,504 | 4,252 | 4,636 |
| Medical Business | 205 | 100 | - | - | - |
| Other | 213 | 189 | 170 | 174 | 116 |
| Total | 32,893 | 37,296 | 35,382 | 30,446 | 36,288 |
Sales Revenue by Business Segment
Sales Revenue by High-Purity Chemical Business
